MH370: the ARC 7
The search for Malaysia Airlines Flight MH370 relied heavily on Inmarsat’s satellite communications system. It provided critical data to help narrow down the plane’s possible flight path. Inmarsat operates a network of satellites that provide global coverage for communication and connectivity services. After the plane disappeared, Inmarsat analyzed seven arcs of satellite data to determine the plane’s possible locations. (see image below).
The arcs were created by measuring the time it took for signals to travel between the plane and Inmarsat’s satellites. By analyzing these time differences, Inmarsat was able to determine that the plane had flown in directions that would had crossed any one of these seven possible arcs, or circles of possible locations, that extended from the last known position of the plane, at particular times as shown in the image below.
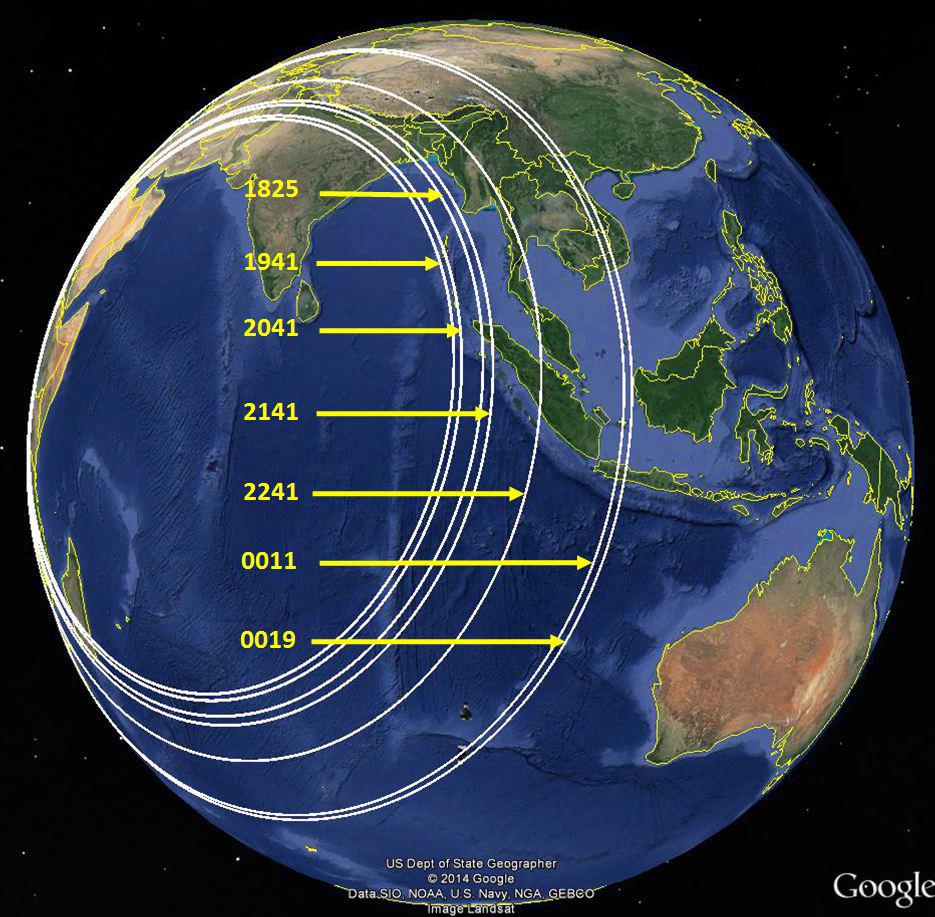
Inmarsat then used a mathematical model to estimate the plane’s speed and direction of travel at the crossing of each arc. This allowed search teams to focus on the areas of the Indian Ocean where the plane was most likely to have crashed.
The Inmarsat data played a critical role in the search for MH370. Their use demonstrated the value of satellite communications and advanced data analysis in aviation safety and accident investigation.
There is a variety of proposed trajectories given by the various experts. It is due to the non-unique way to interpret the possible flight plan for the aircraft that would satisfy the Inmarsat arc data. I shall not discuss this over here as different experts have already interpreted it in the websites I have quoted.
However, the last arc (Arc 7), is the one that contains the final recorded data by Inmarsat of the plane. After crossing it, we assume that the plane disappeared (descended to the sea). Dr Ian Holland analyzed these data and suggested a very rapid descend of the aircraft.
The scenario that prevails is that after passing Arc 6, the aircraft eventually run out (or appeared to run out) of fuel, according to data interpretation by Boeing. A complex sequence of events followed (discussed and analyzed in different ways by the experts I mentioned earlier). It was initiated by the flame-out of the right engine. Then followed later on by the flame-out of the left engine due to the fuel exhaustion. Then by subsequent activation of the APU (Auxiliary Power Unit). After approximately 1 minute the APU was fully operational. Then the SDU (satellite data unit) reset itself. This lasted about 1 extra minute, after the APU (auxiliary power unit) was initiated. Then the logon to the Inmarsat started at 00:19:29Z and it was interrupted 8 seconds later at 00:19:37Z. That was the last transmission of the MH370. This 8 seconds interval defines overall the Arc 7.
According to the analysis of Dr Ian Holland, the aircraft was already diving. Initially at vertical speeds between 3,900 and 14,800 fpm when the logon started. And just 8 seconds later at vertical speeds between 14,800 and 25,300 fpm, when the logon was interrupted. He also estimated that during these 8 seconds the average vertical acceleration of the aircraft was about 0,68g. The detailed table of his analysis is as below:

In his publication Dr Holland mentioned that these descent rates are consistent with simulations of an uncontrolled phugoid descent. He reported it in an Australian Transport Safety Bureau publication.
To shed some light on the potential scenarios after the crossing of the Arc 7, Boeing conducted 10 simulations. This was to determine the behaviour of MH370 after fuel exhaustion with no pilot inputs. They used a high-fidelity simulator for the 777-200ER aircraft. Boeing obtained advice from the ATSB to define scenarios with reasonable values for the aircraft parameters. They included speed, fuel, electrical configuration and altitude, along with the turbulence level.
Dr Victor Iannello in his blog in August 2018 described a summary of the important details of these simulations. With the authorization of the ATSB he made available in his blog the numerical results of the ten simulation runs. They were in the form of X, Y, and altitude in one second increments. X is the E-W position in NM, Y is the N-S position in NM, and the altitude is in feet. (The ATSB deliberately did not include the latitude and longitude values in these files. So there was no association with a particular crossing of the 7th arc.)
There were two groups of simulations:
- In the first group (Cases 1,2,5,7,8,9), the autopilot was lost after the flameout of the second (left) engine, which corresponds to a “normal” configuration of the electrical system.
- In the second group (Cases 3,4,6,10), the electrical configuration was in an “alternate” configuration in which the left generator and left backup generator were isolated with switches in the overhead panel. In this case, when the right engine is running, power is supplied to the left bus from the right bus through the bus tie breaker. However, after the first (right) engine flames out, both main AC busses and both transfer busses lose power, which causes the flight control mode to transition to “secondary” and the autopilot and auto-throttle disengage, even as the left engine continues to provide thrust.
I present the results of the simulations in the figure below. Dr Iannello aligned these results to the point two minutes after the loss of power from the engines. This is the theorized time at which the 7th arc transmissions would have been sent.
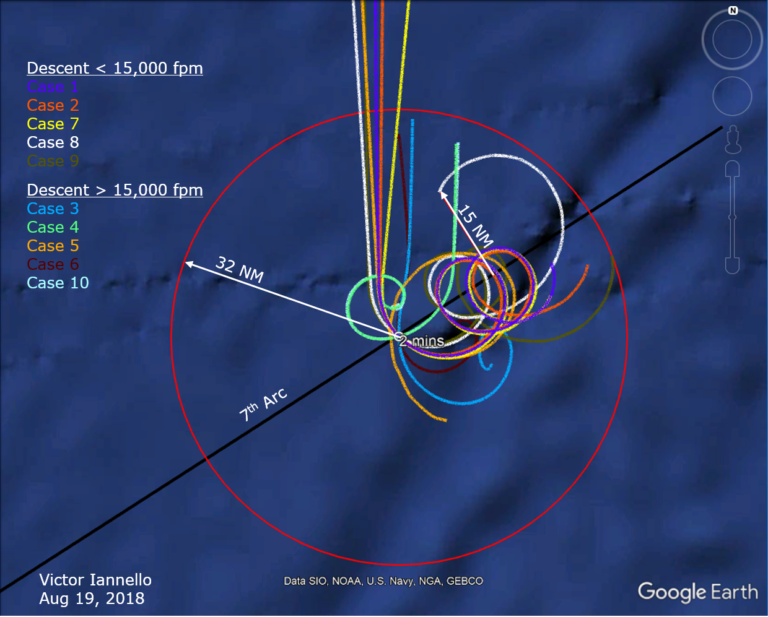
In 2021 I was given access to these ATSB results by Dr Iannello and analyzed them by numerical differentiation etc. to reconstruct the velocity and acceleration vector of the plane plus solve the equilibrium equations in an attempt to “simulate” the trajectories concerned in terms of roll-pitch-yaw of the plane. Then I classified the trajectories according to their satisfaction of the “Holland criteria”, that is, exhibit the vertical speed ranges of the above table for any pair of instants separated by 8 seconds during the trajectory, but only in the proximity of the 2 minutes after total flame-out, AND having on average over these 8 seconds interval a downward acceleration of as close as possible to 0.68g.
My findings were in good agreement with those published by Dr Iannello.
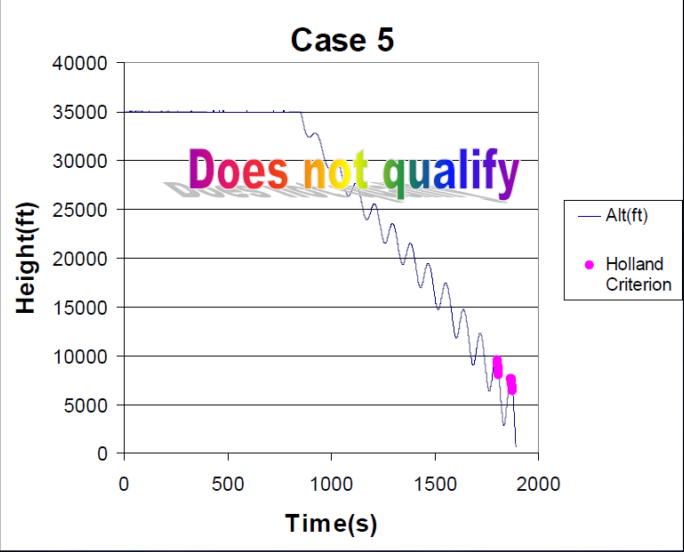
I discovered that none of the first group simulations (Cases 1,2,5,7,8,9) satisfies the Holland criteria. All these simulations exhibited phugoid motion with increasing amplitude and violent end in the sea. Only Case 5 satisfied the vertical speed criteria but just before sea impact and not at logon. I show here the height evolution versus time:
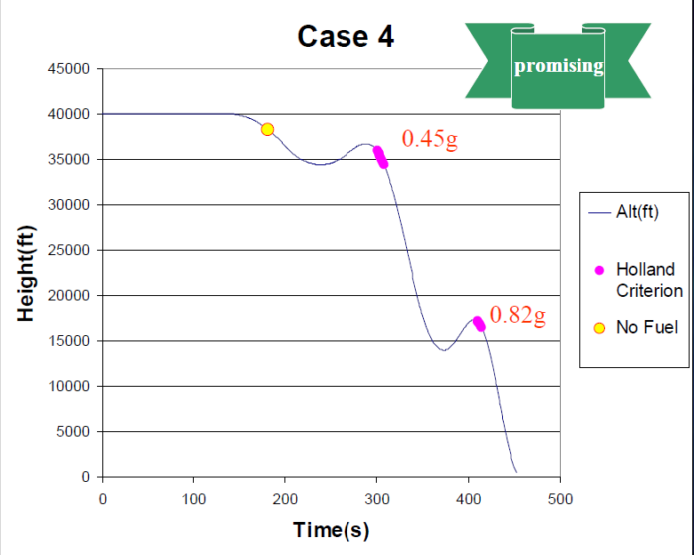
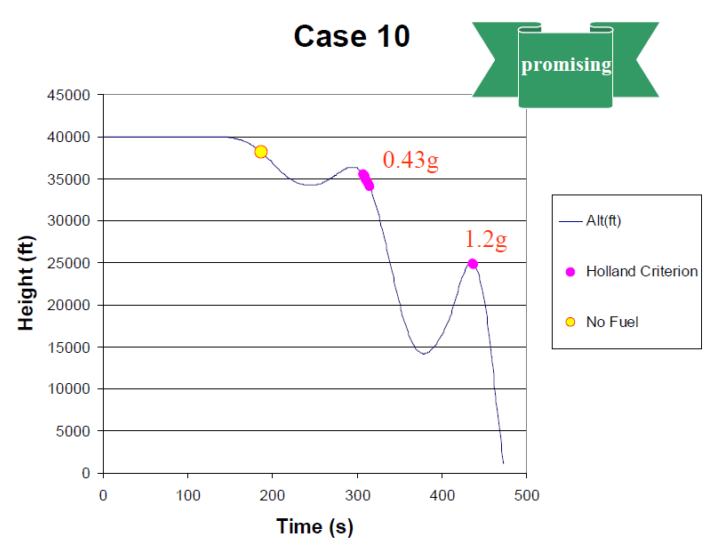
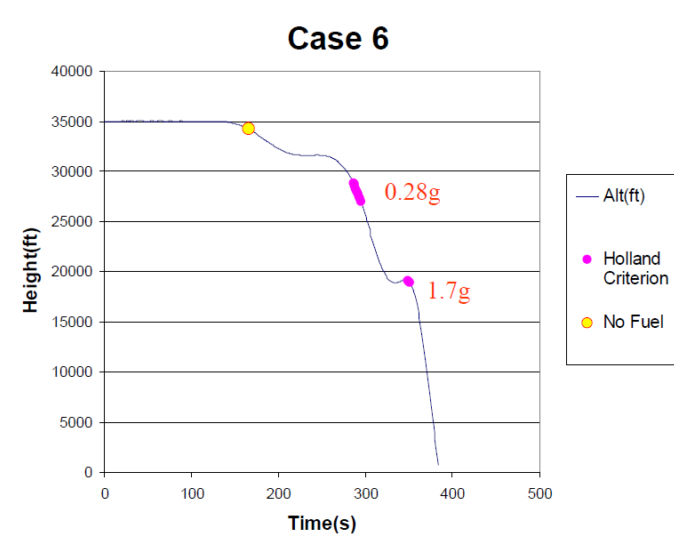
From the second group (Cases 3,4,6,10) I found that only two (Cases 4 and 10) appear to almost satisfy all the Holland criteria while Case 6 is close. They have average accelerations of about 0.45g (instead of 0.68g) close to the 2 minutes after flame-out. They correspond to a mixture of spiral descend with a mild phugoid.
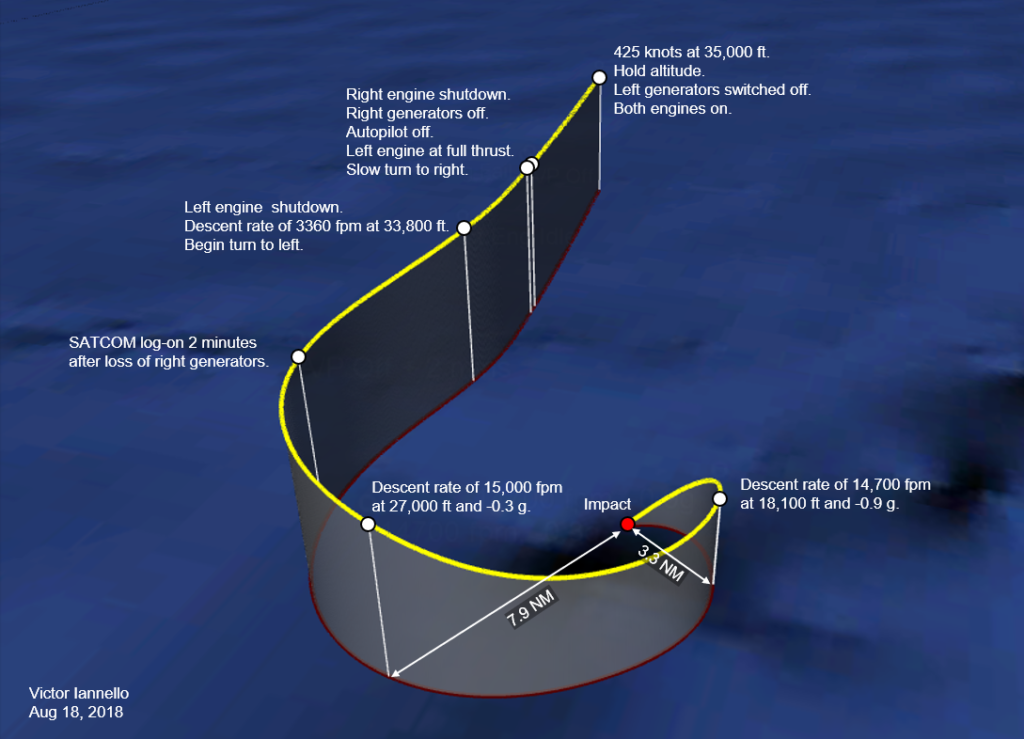
Here are the comments from Dr Iannello’s publication: There were five simulations (Cases 3,4,5,6,10) in which the rate of descent exceeded 15,000 fpm and the downward acceleration exceeded 0.67g, which are the values indicated by the two final values of BFO. This included all four cases with the “alternate” electrical configuration, and one with normal configuration. The maximum downward acceleration for these cases ranged between 0.87g and 1.30g. For the five simulations (Cases 3,4,5,6,10) with high descent rates, the descent rate of 15,000 fpm and the downward acceleration of 0.67g occur at different times, and are not predicted to occur at the time of the log-on.
Regarding Case 6, Dr Iannelo published his 3D reconstruction of the final event as below:
While my analysis gave the following assessment, which is in reasonable agreement with the comments of the above figure, especially for the instant at 2 minutes after flame-out (no fuel):
It is important to remember that these were not supposed to be simulations of the MH370 as we do not know the actual initial conditions at total flame-out. However what we know is the Holland criteria for a scenario to be credible.
I embarked to this investigation in order to discover what possible mechanism can produce so high vertical speeds over an interval of 8 seconds just 2 minutes after flame-out as Dr Holland has discovered and in this respect these simulations gave a lot of insight, in particular Case 10.
By solving the equilibrium equations in time using the Case 10 trajectory, I could observe that the aircraft appeared to develop a phugoid motion during the 2 minutes until logon started and then rapidly switch to a spiral descend via a large roll to the right. At all time the aircraft was never flying level, something that Dr Iannello noted: “In none of the simulations did the plane fly straight with level wings after the autopilot was disengaged.“

Initiation of dive (phugoid) after flame-out
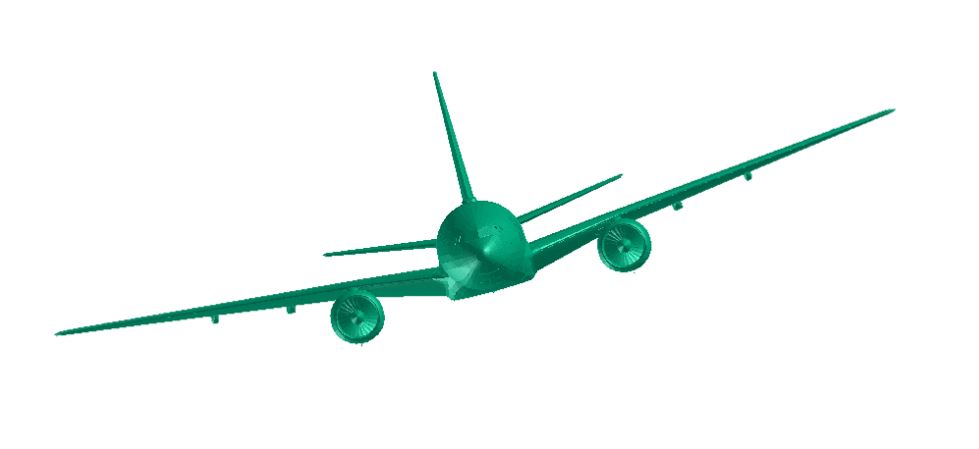
At bottom of the first phugoid (1 minute after flame-out, APU activated)
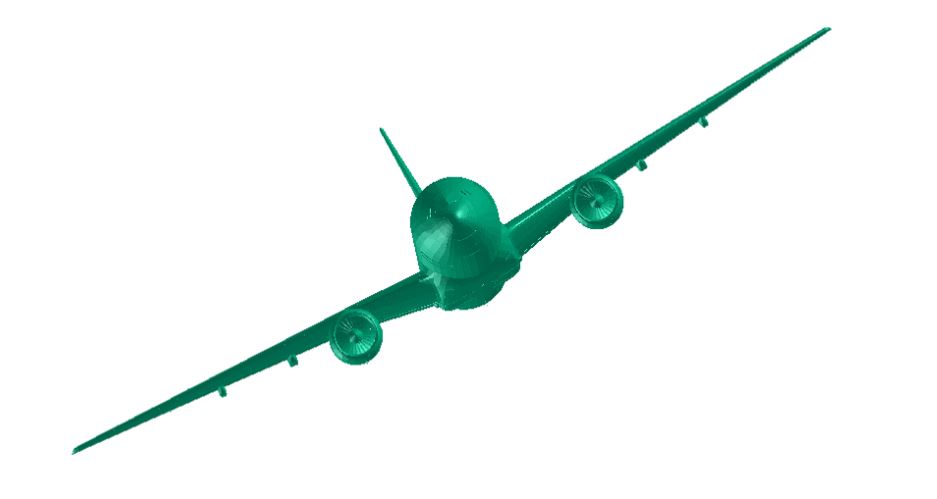
Climbing up, developing a roll to the right
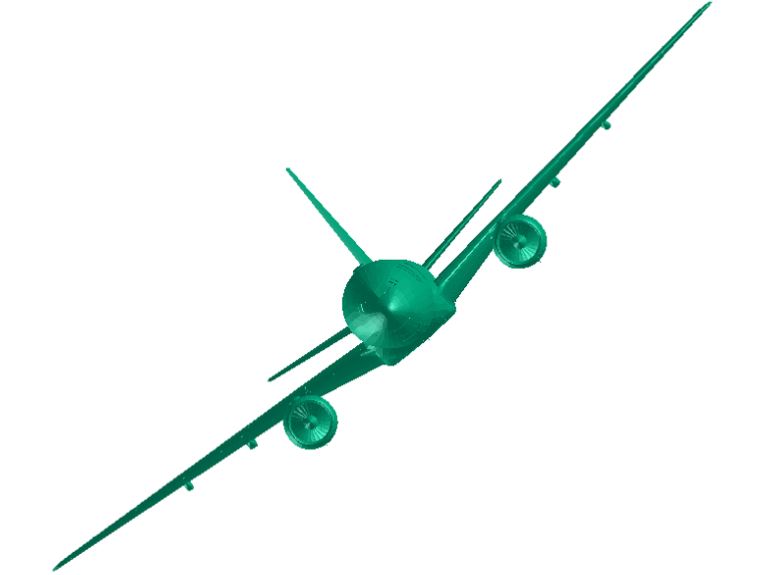
Peak of the climb, instant after which logon starts (2 minutes after flame-out) – switching to a right roll
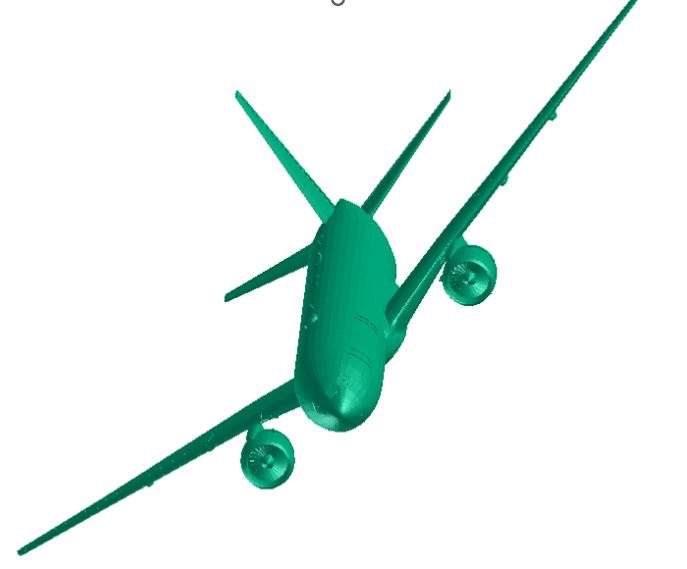
8 seconds later, Holland criteria satisfied, developing a spiral dive to the right
According to my preliminary analysis of 2021, it is my personal conviction that the above scenario appears as the most likely one for the MH370 crossing the Arc 7 and satisfying the Holland criteria. Such a scenario will lead to a violent crash to the ocean, if the aircraft remained unpiloted. This contradicts my appreciation of the debris evidence which appears to suggest a missed but piloted ditching. Therefore the aircraft which would had been uncontrollable between flame-out and 2 minutes plus 8 seconds later, developed a sharp spiral dive but recovered some limited controllability for a ditching to be attempted.
The type of scenario that permits such a recovery of limited controllability of the MH370 is something that I have neither the competence nor the intention to assess and I invite other experts to examine.